
Movilidad Social (índice)
The Global Social Mobility Report 2020; Equality, Opportunity and a New Economic Imperative
Supongo que en nuestras Facultades de Sociología este contenido lo tendrán ya suficientemente trabajado…
Los cálculos se efectúan siguiendo estos criterios:
To allow the aggregation of indicators of different nature and magnitude, each indicator entering the Global Social Mobility Index is converted into a unit-less score, called “progress score”, ranging from 0 to 100 using a min-max transformation. Formally, each indicator is re-scaled according to the following formula:

where valuei,c is the “raw” value of country c for indicator i, worst performance (wpi,) is the lowest acceptable value for indicator i and frontier i corresponds to the best possible outcome. Depending on the indicator, the frontier may be a policy target or aspiration, the maximum possible value, or a number derived from statistical analysis of the distribution (e.g. 90th or 95th percentile). If a value is below the worst performance value, its score is 0; if a value is above the frontier value, its score is capped at 100.
In the case of indicators derived from the Executive Opinion Survey, frontieri and wpi values are always 7 and 1, respectively. These values correspond to the two extreme answers of any questions. Table 1 below provides the actual floor and frontier values used for the normalization of each individual indicator.
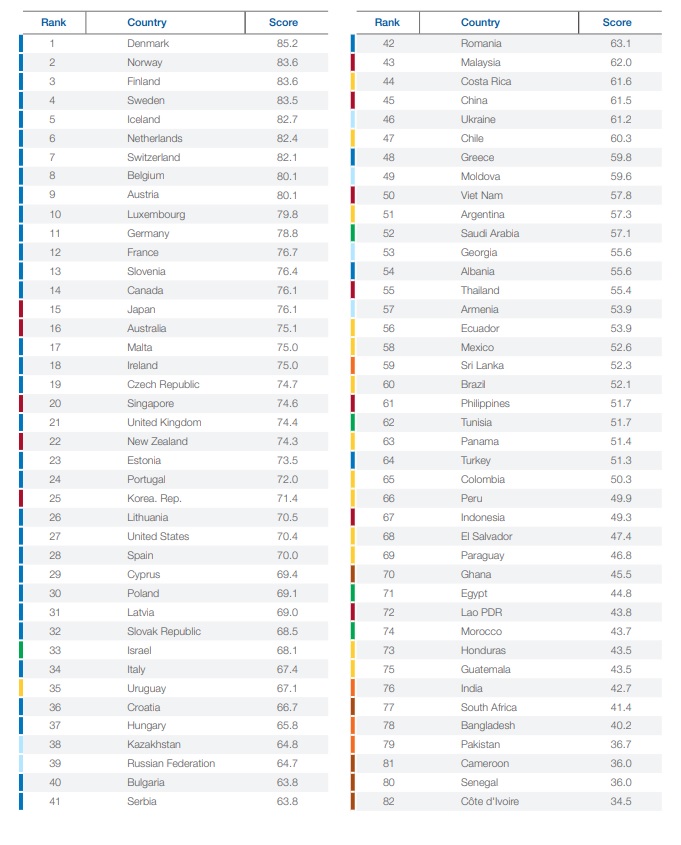
De acuerdo a ello, obtienen la siguiente clasificación:
Movilidad, ranking general. España se posiciona en 28 lugar
Sin embargo, en este componente, España se sitúa en el quinto lugar!!!!. Y es un componente importante, ¿no?

Estudio en PDF. Ahí se incluyen los datos (conociendo que es difícil disponer de ellos y asegurar su calidad!; claro que, para mi, son mejores que creer en la opinión del Líder Supremo)
¿Y que parámetros trabajan?
| Indicator titles and units | Frontier | Worst performance | Guiding principle | |
| 1.01 | Adolescent birth rate per 1.000 women | 100 | 0 | 95th percentile rounded up to 100 |
| 1.02 | Prevalence of malnourishment (% of 5-19 year olds) | 50 | 0 | Arbitrary min max |
| 1.03 | Health Access and Quality Index (0–100 best) | 100 | 0 | Extreme values of the IHME Index |
| 1.04 | Inequality-adjusted healthy life expectancy index (0–100 best) | 72 | 40 | Health adjusted life expectancy score based on Human Development Report 2016 Practice |
| 2.01 | Pre-primary enrolment (%) | 100 | 0 | Range of possible values |
| 2.02 | Quality of vocational training (1–7 best) | 7 | 1 | Range of possible values |
| 2.03 | NEET ratio (% of 15–24 year olds) | 30 | 0 | Natural min and arbitrary maximum |
| 2.04 | Out-of-school children (%) | 10 | 0 | Natural min. 95th percentile rounded |
| 2.05 | Inequality-adjusted education index (0–100 best) | 1 | 0 | Natural min. round 95th percentile |
| 3.01 | Children below minimum proficiency (%) | 70 | 0 | Natural min. round 95th percentile |
| 3.02 | Pupils per teacher in pre-primary education | 35 | 5 | 5th percentile rounded/arbitrary max |
| 3.03 | Pupils per teacher in primary education | 40 | 10 | Arbitrary min/arbitrary max |
| 3.04 | Pupils per teacher in secondary education | 35 | 5 | Arbitrary min/arbitrary max |
| 3.05 | Harmonized learning outcomes (score) | 600 | 200 | Natural min/arbitrary max |
| 3.06 | Social diversity in schools (score) | 91 | 50 | Min rounded to 50/arbitrary max |
| 3.07 | Percentage of disadvantaged students in schools which report a lack of education material | 100 | 0 | Arbitratry min/arbitraty max |
| 4.01 | Extent of staff training (1–7 best) | 7 | 1 | Range of possible values |
| 4.02 | Active labour market policies (1–7 best) | 7 | 1 | Range of possible values |
| 4.03 | Access to basic services through ICTs (1–7 best) | 7 | 1 | Range of possible values |
| 4.04 | Percentage of firms offering formal training | 75 | 0 | Both extremes rounded |
| 4.05 | Digital skills among active population (1–7 best) | 7 | 1 | Range of possible values |
| 5.01 | Internet users (%) | 100 | 0 | GCI 4.0 2019 value |
| 5.02 | Fixed-broadband internet subscriptions per 100 pop. | 50 | 0 | GCI 4.0 2019 value |
| 5.03 | Mobile-broadband subscriptions per 100 pop. | 120 | 0 | 120 is the value above which mobile broadband technology is considered sufficiently widespread not to constitute a constraint for the average user |
| 5.04 | Population covered by at least a 3G mobile network (%) | 100 | 0 | Range of possible values |
| 5.05 | Rural population with electricity access (%) | 100 | 0 | Range of possible values |
| 5.06 | Internet access in schools (1–7 best) | 7 | 1 | Range of possible values |


Debe estar conectado para enviar un comentario.